issuer PR Dashboard: Web UI on Top of SQLite + LLM Reviews
A web dashboard for 96 PR reviews — built with Python stdlib, Chart.js, and zero external server dependencies.
The previous post covered how issuer grew from an issue triage tool into a PR review pipeline — syncing 96 pull requests, analyzing diffs with DeepSeek V4 Pro, and storing structured verdicts in SQLite.
This post covers what came next: a web dashboard to browse, filter, sort, and inspect every PR review — built with zero Python dependencies, zero JavaScript frameworks, and zero build steps.
Why a dashboard?
The CLI tools work fine for one-off queries:
1
$ issuer pr-list --verdict changes_requested
But scanning 96 PRs with their verdicts, issues, and summaries calls for something more visual. I wanted:
- A bird’s-eye view of all verdicts at once
- Charts showing the distribution
- Filters to slice by verdict, confidence, or search text
- Click-to-inspect modal for each PR’s full review
- Something I could start from the terminal and kill when done
The constraint was the same as everything in issuer: no external Python dependencies beyond stdlib. The whole project runs on a stock Python 3 install. No Flask, no FastAPI, no npm.
The architecture
1
2
3
4
5
6
7
8
9
10
11
12
13
14
┌─────────────┐     ┌──────────────┐     ┌───────────────┐
│ SQLite      │────▶│ /api/data    │────▶│ Chart.js      │
│ issuer.db   │     │ (JSON)       │     │ (CDN)         │
└─────────────┘     └──────────────┘     └───────────────┘
                           │                     │
                     ┌─────▼─────────┐    ┌──────▼─────────┐
                     │ Stats grid    │    │ Table with     │
                     │ + 2 charts    │    │ filter/sort    │
                     └───────────────┘    └──────┬──────────┘
                                                 │
                                          ┌──────▼──────────┐
                                          │ Modal: per-PR   │
                                          │ detail view     │
                                          └─────────────────┘
The server (http.server.HTTPServer + BaseHTTPRequestHandler) serves two routes:
GET /— the dashboard HTML itselfGET /api/data— all PR data serialized to JSON
That’s it. One endpoint, one HTML blob. The client fetches data once, stores it in window.data, and handles all rendering client-side.
The server is started as a subcommand:
1
2
$ issuer dashboard
issuer dashboard → http://0.0.0.0:5199
Open http://localhost:5199 in any browser and the full dashboard loads.
The visual design
Dark theme matching GitHub Dark (#0d1117 background). The layout has:
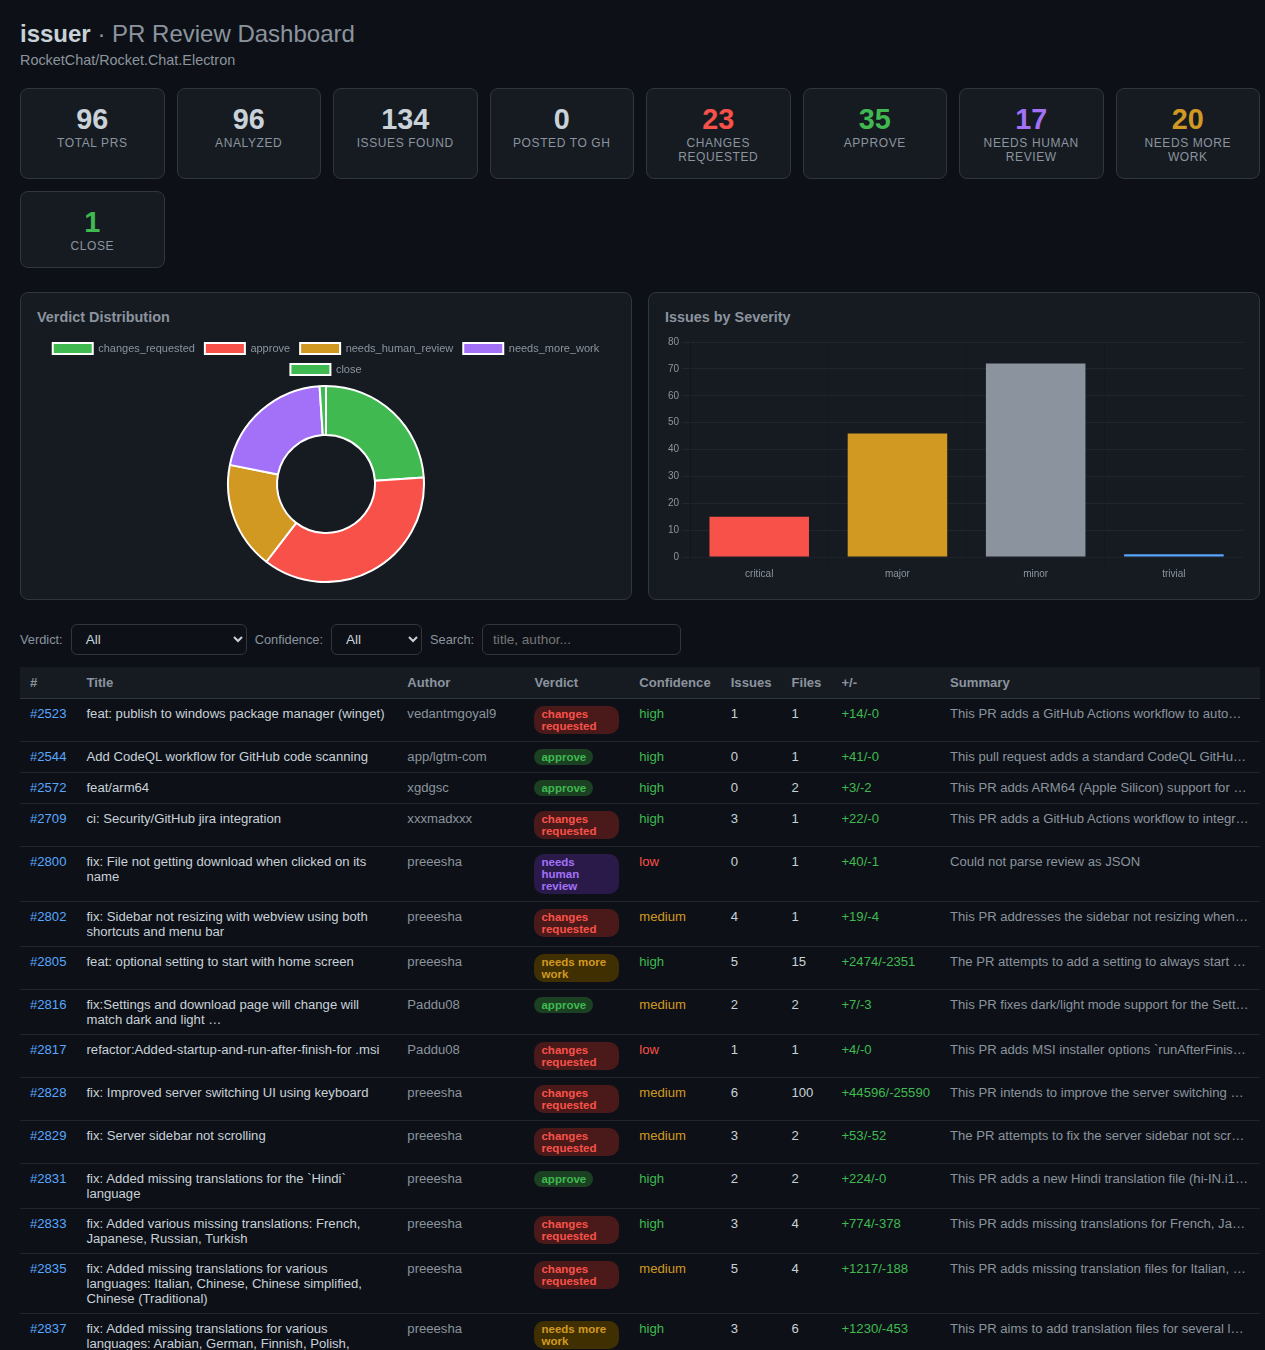
- Stats grid — dynamically generated cards for total PRs, analyzed count, issues found, and one card per verdict with its count and color
- Two charts — a doughnut chart for verdict distribution (green for approve, red for changes_requested, yellow for needs_more_work, purple for needs_human_review) and a bar chart for issues by severity (critical, major, minor, trivial)
- Filter bar — dropdowns for verdict and confidence, plus a text search that matches title and author
- Sortable table — click any column header to sort by that field; click again to reverse
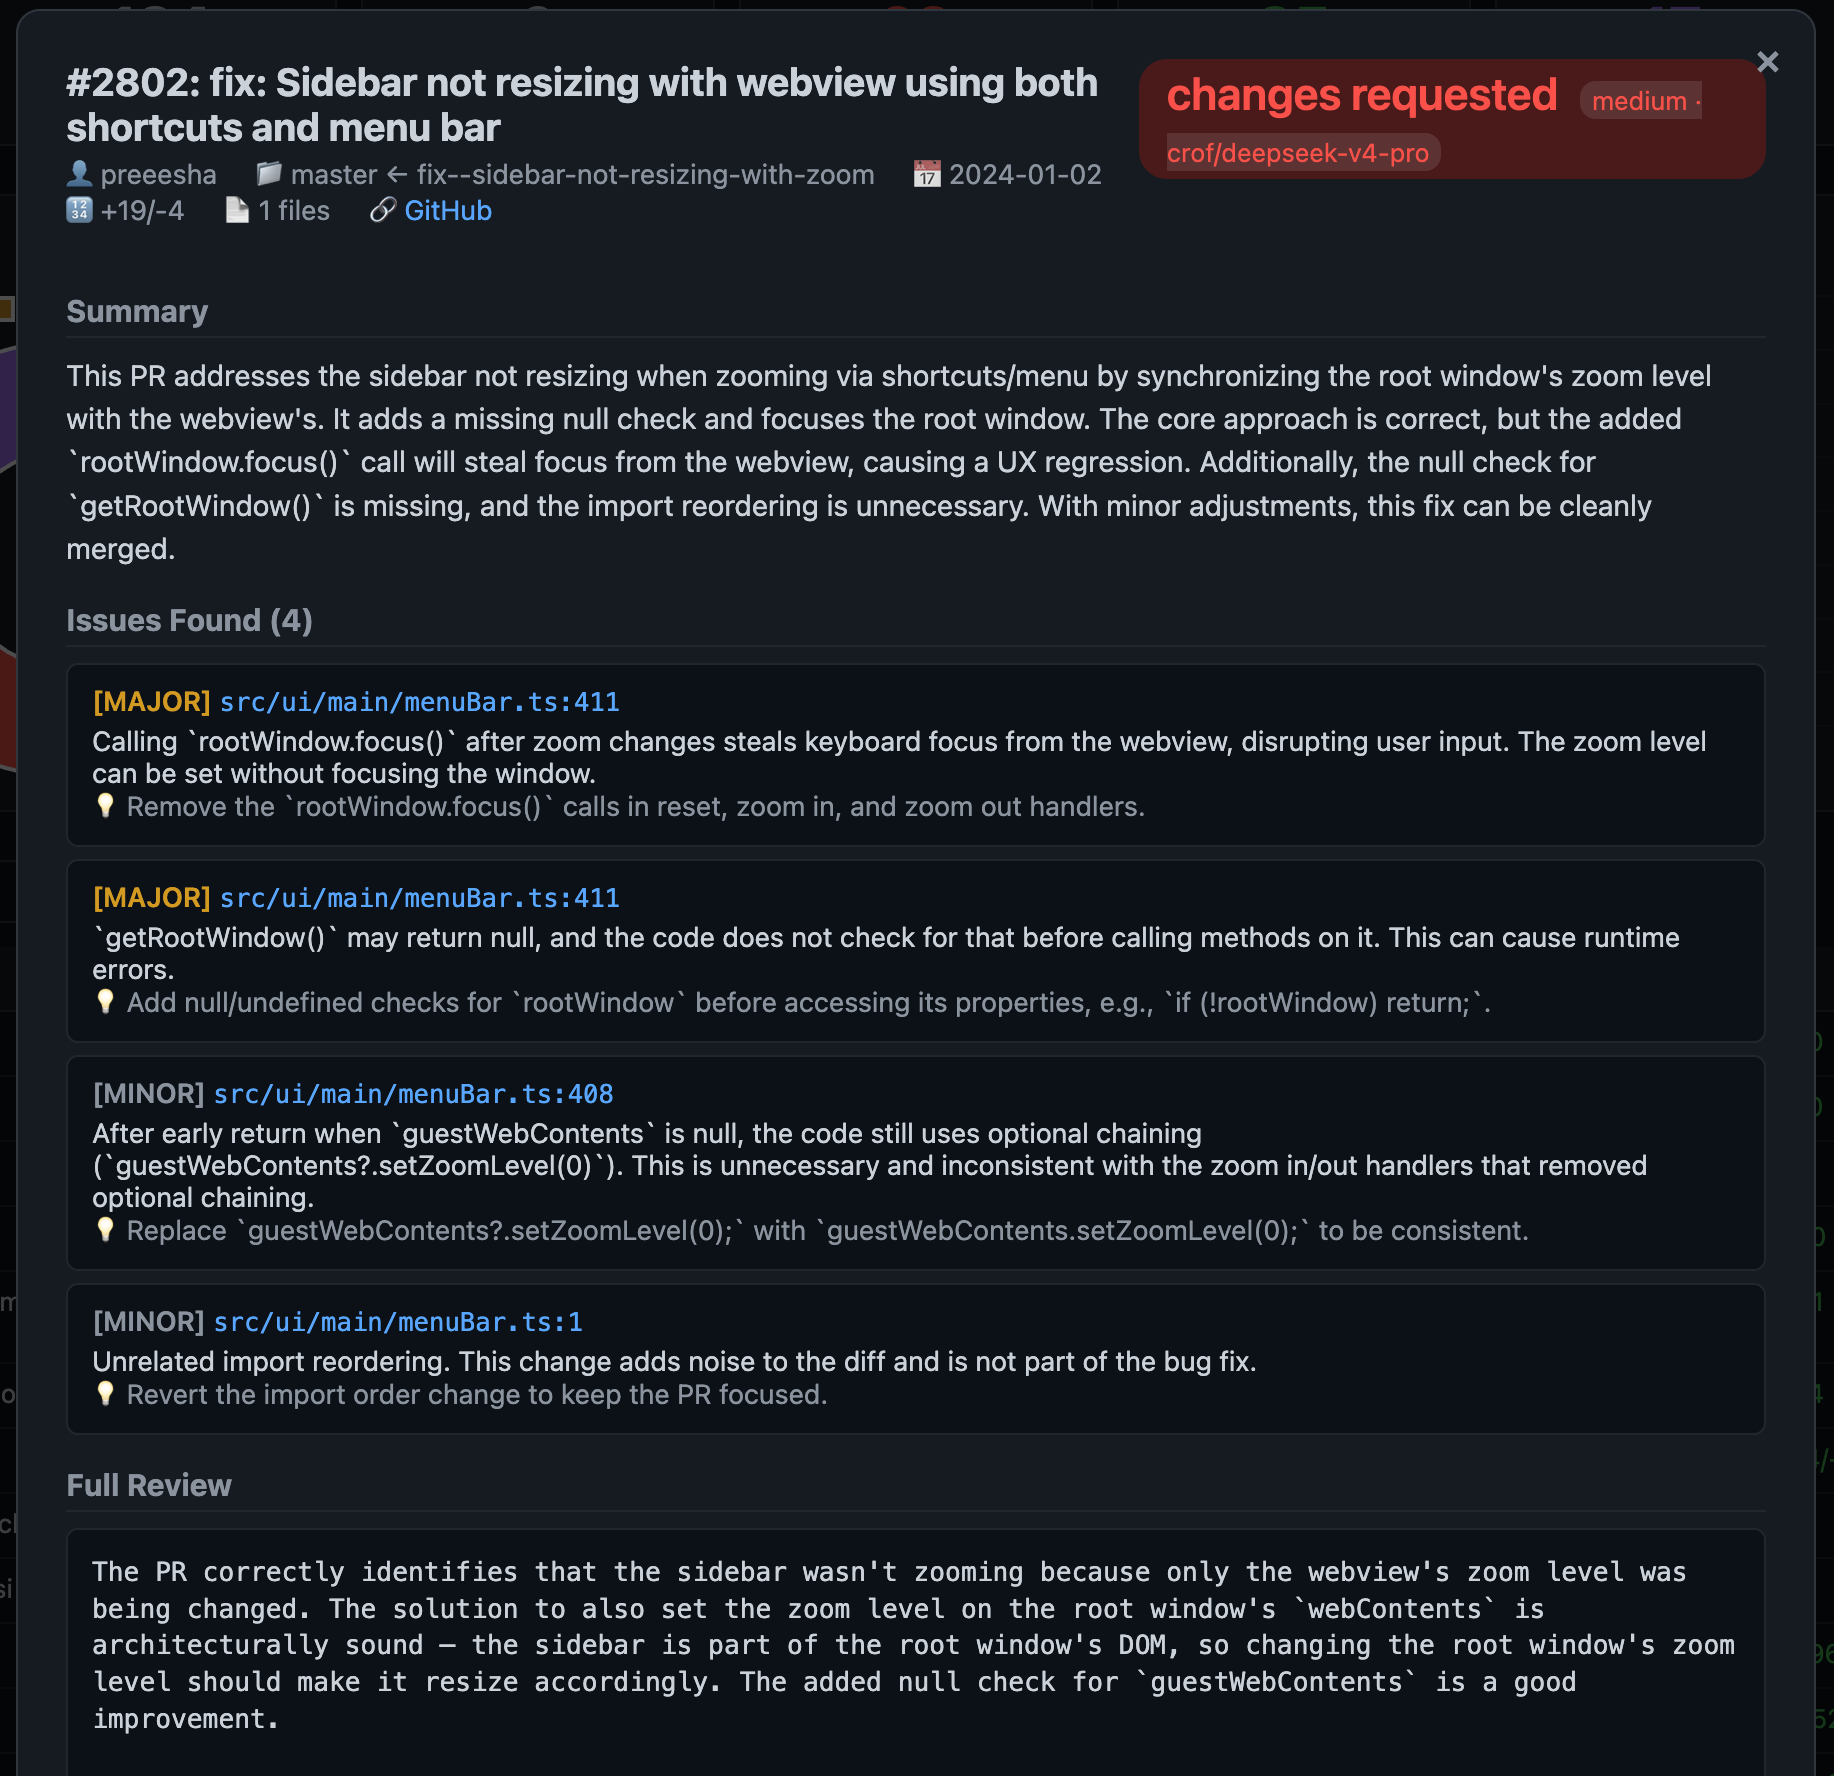
- Detail modal — click any row to see the full PR analysis: summary, structured issues with severity/file/description/suggestion, and the raw review text
The whole thing is ~400 lines of Python + inline HTML/CSS/JS. The CSS is 60 lines. The JavaScript (including Chart.js calls, filtering, sorting, and modal) is ~130 lines. No build step, no bundler, no dev server.
Dashboard overview
Detail modal
What I learned
1. Python stdlib http.server is enough
I’ve reached for Flask or FastAPI by reflex many times. For a single-page dashboard served from a CLI tool, http.server is adequate. The handler is 15 lines. The API endpoint is another 15 lines. No dependency hell, no version conflicts, no pip install instructions.
The trade-off is that you’re writing your own routing (a few if/elif branches) and serving everything inline. For more than 3-4 routes, the friction starts to show.
2. Chart.js from CDN avoids build entirely
No npm, no webpack, no bundler. A single <script> tag pulls in the library. Two new Chart() calls render the charts. The whole thing is cached by the browser on first load.
3. Inline data loading is simpler than per-PR endpoints
The initial design had an endpoint like /api/pr/2523 for individual PR details. But since the full dataset is only ~96 rows with small fields, loading everything into window.data via a single /api/data call is faster and simpler. The modal uses data.prs.find(n => n.number === N) — no network request, no loading state, no caching logic.
4. The click-on-row modal was harder than it should have been
Getting click on a table row to reliably open the modal took five iterations. The issue was that <a> elements inside the row (linking to GitHub) were eating the event in certain browser automation contexts. The fix was:
cursor:pointeron<tr>so it’s visually clear it’s clickableonclick="openPrSync(N)"directly on the<tr>element- No
event.stopPropagation()on the<a>tags — let the link handle its own click while the row click propagates separately
5. Filter + sort in the client is faster than going back to the server
Each filter or sort change re-renders the table from window.data via innerHTML. With 96 rows, rendering takes under 10ms. There’s no network request, no loading spinner, no server round trip. The response is instantaneous.
Code highlights
The full server:
1
2
3
4
5
6
7
8
9
10
11
12
13
14
15
16
17
18
19
20
21
22
23
24
25
26
27
28
29
30
31
32
def run_server(host="0.0.0.0", port=5199):
    from http.server import HTTPServer, BaseHTTPRequestHandler
    import urllib.parse

    HTML = _build_html()

    class Handler(BaseHTTPRequestHandler):
        def do_GET(self):
            parsed = urllib.parse.urlparse(self.path)
            path = parsed.path.rstrip("/")

            if path == "" or path == "/":
                self.send_response(200)
                self.send_header("Content-Type", "text/html; charset=utf-8")
                self.end_headers()
                self.wfile.write(HTML.encode())
            elif path == "/api/data":
                data = load_data()
                self.send_response(200)
                self.send_header("Content-Type", "application/json")
                self.send_header("Access-Control-Allow-Origin", "*")
                self.end_headers()
                self.wfile.write(json.dumps(data).encode())
            else:
                self.send_response(404)
                self.send_header("Content-Type", "text/plain")
                self.end_headers()
                self.wfile.write(b"Not found")

    server = HTTPServer((host, port), Handler)
    print(f"issuer dashboard → http://{host}:{port}")
    server.serve_forever()
The modal function:
1
2
3
4
5
6
7
8
9
10
11
12
13
14
15
16
17
18
19
20
21
22
23
24
25
26
27
28
29
30
31
32
33
34
35
36
37
38
39
function openPrSync(number) {
const p = (data.prs || []).find(pr => pr.number === number);
if (!p) return;
document.getElementById('modal-content').innerHTML = `
<button class="modal-close" onclick="closeModal()">×</button>
<div class="flex-header">
<div>
<h2>#${p.number}: ${p.title}</h2>
<div class="pr-meta">
<span>👤 ${p.author||'—'}</span>
<span>📁 ${p.base_branch||'?'} ← ${p.head_branch||'?'}</span>
<span>📅 ${(p.created_at||'').slice(0,10)}</span>
<span>🔢 +${p.additions||0}/-${p.deletions||0}</span>
<span>📄 ${p.files_changed||0} files</span>
<span><a href="${p.url}" target="_blank">🔗 GitHub</a></span>
</div>
</div>
<span class="verdict-big badge ${p.verdict}">${p.verdict.replace(/_/g,' ')}</span>
</div>
<h3>Summary</h3>
<div class="summary-text-full">${p.summary||'No summary available.'}</div>
${p.issues.length ? `
<h3>Issues Found (${p.issues.length})</h3>
<ul class="issues-list">
${p.issues.map(i => `
<li>
<span class="sev ${sevClass[i.severity]}">[${i.severity.toUpperCase()}]</span>
<span class="file">${i.file||'?'}${i.line ? ':'+i.line : ''}</span>
<div class="desc">${i.description} ${i.suggestion ? '<br>💡 '+i.suggestion : ''}</div>
</li>
`).join('')}
</ul>` : ''}
${p.review_text ? `
<h3>Full Review</h3>
<div class="review-text-box">${p.review_text.replace(/</g,'<')}</div>` : ''}
`;
document.getElementById('pr-modal').classList.add('open');
}
What’s next for the dashboard
Things I want to add:
- Diff viewer — embed the PR diff in the modal with syntax highlighting
- Confidence trend — see which models produce which verdicts
- Export — download filtered results as CSV or JSON
- Auto-refresh — polling or server-sent events to pick up new reviews without reloading
- Responsive for mobile — the table is usable on desktop but needs horizontal scroll on small screens
But even in its current state — ~400 lines, zero deps, one evening of work — it turns 96 PR reviews from a database query into something browsable in real time.
Built with Python stdlib, Chart.js, and SQLite. Written with DeepSeek V4 Pro.